Extension
Data-driven tools that make Taiwan’s public data easier to explore: interactive visualizations and R packages for government open data.
Taiwan Crash Atlas
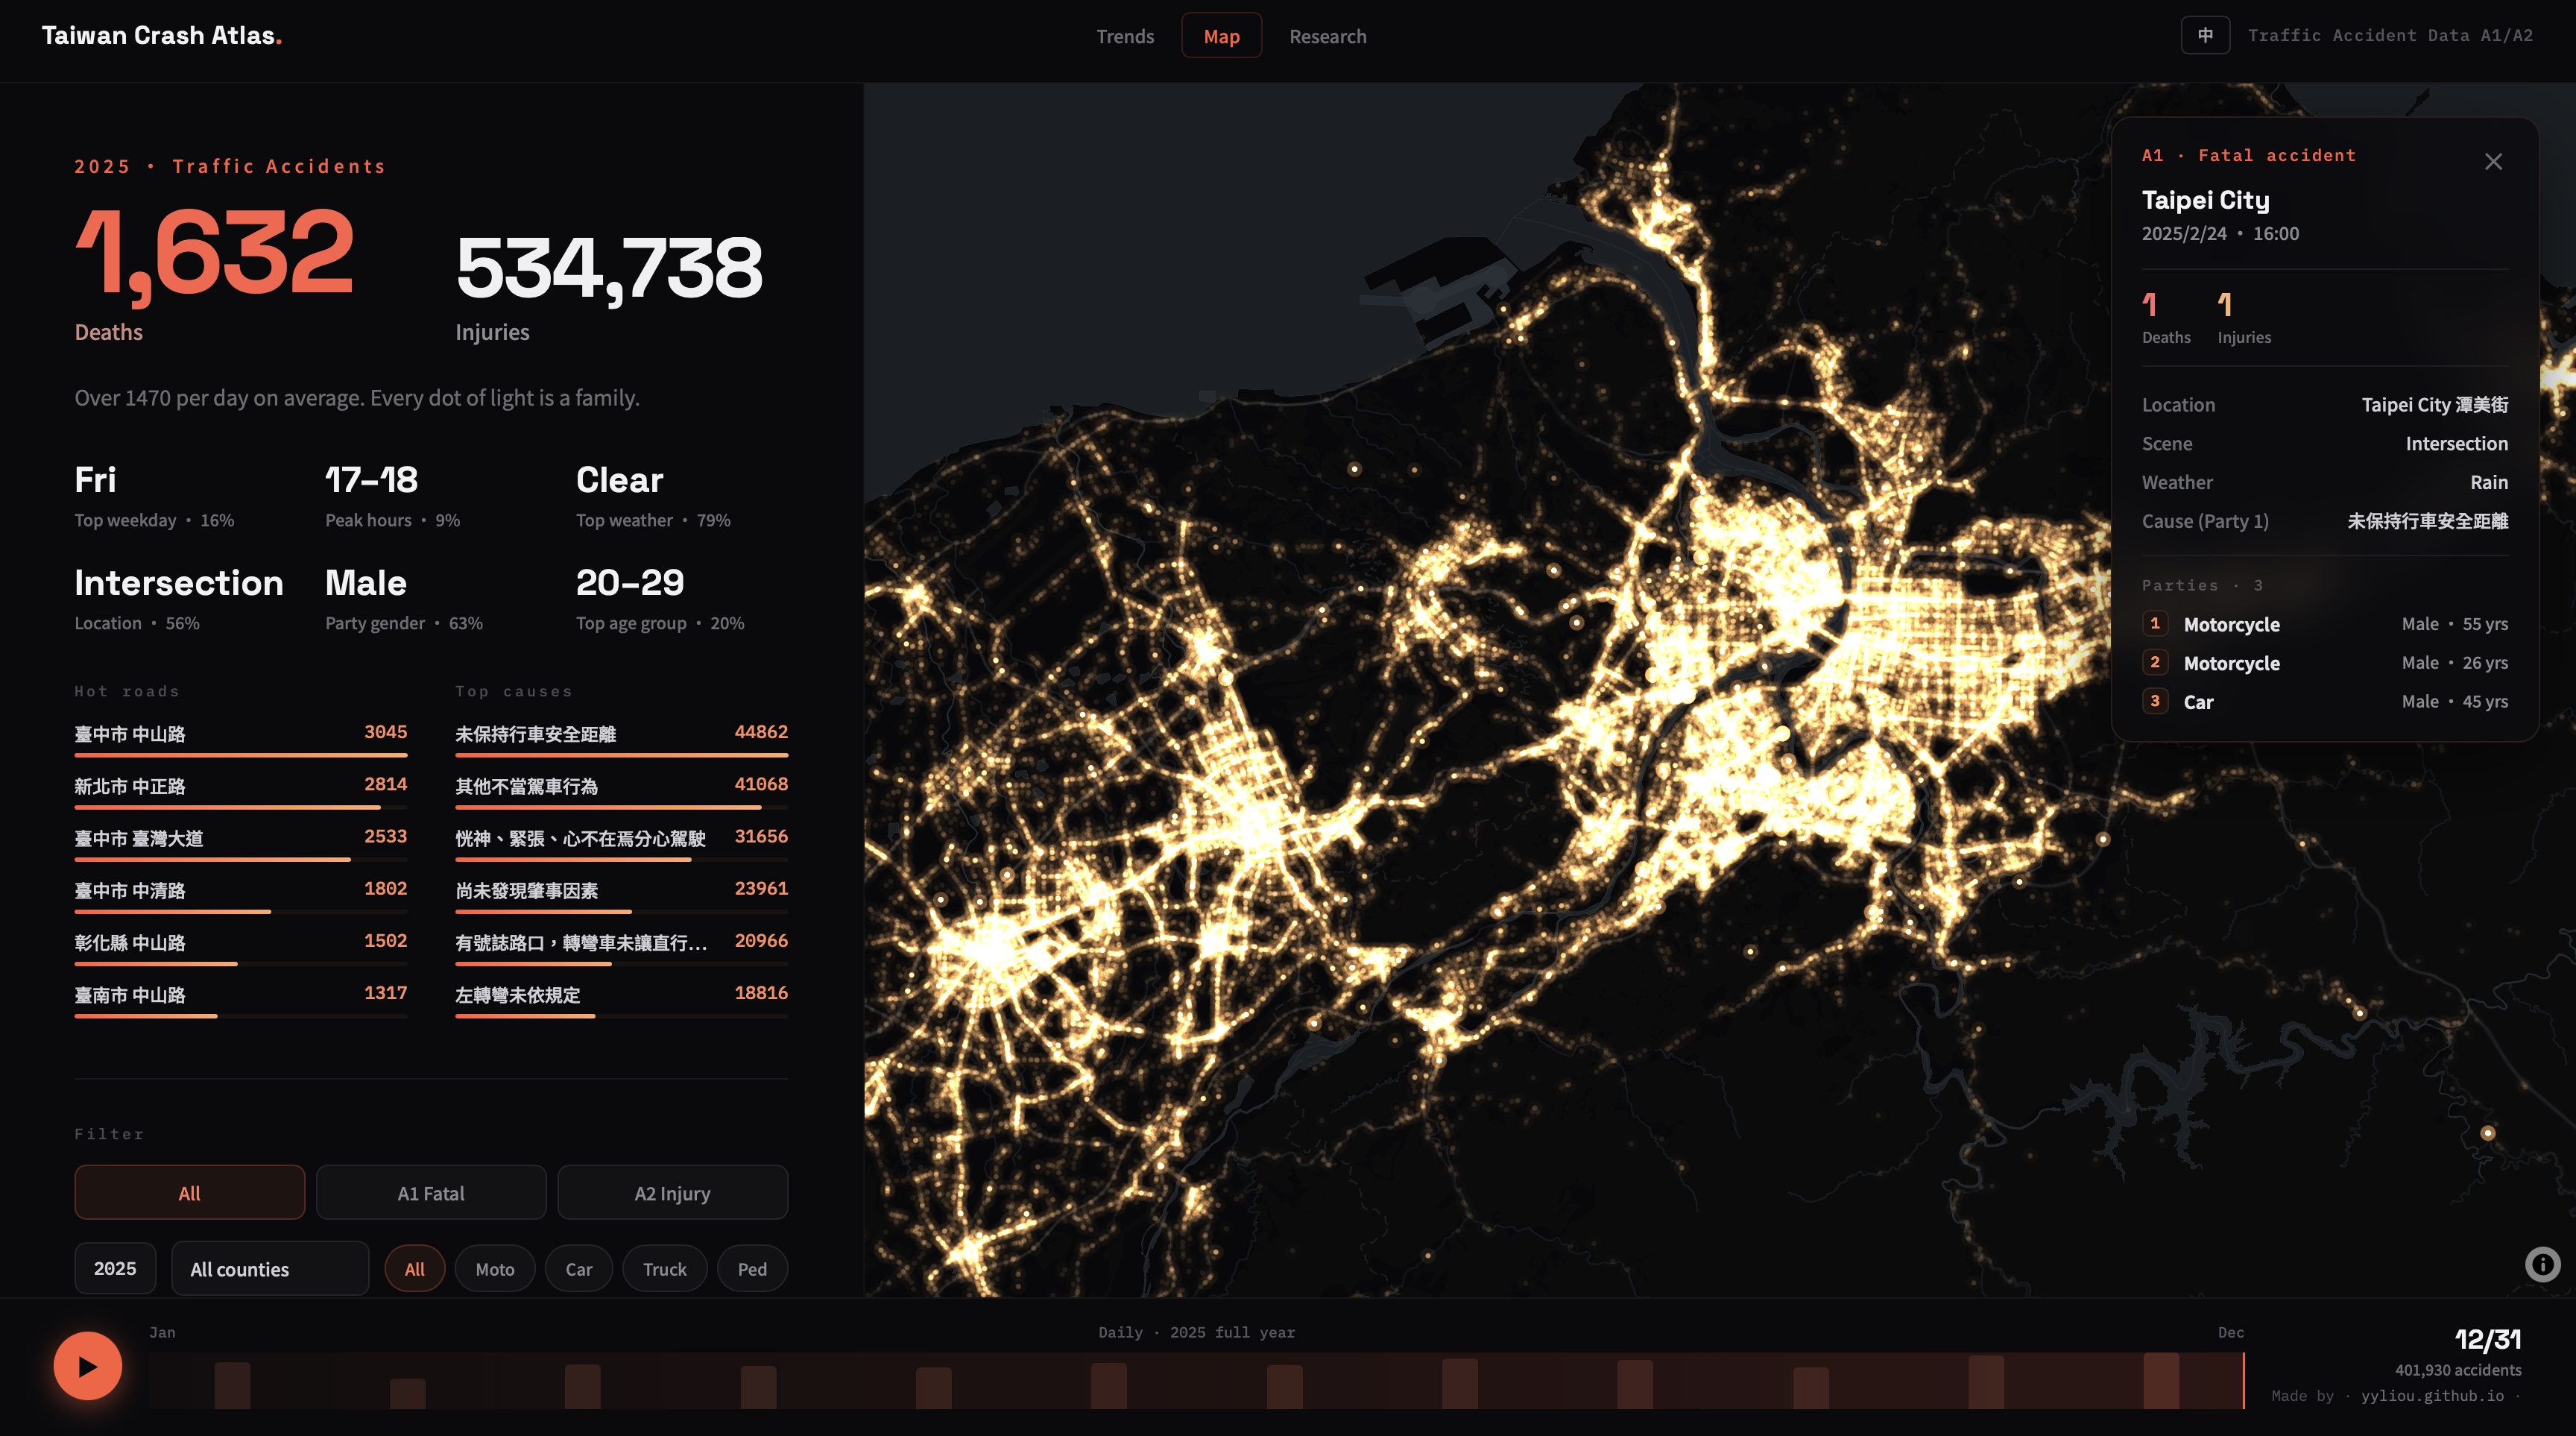
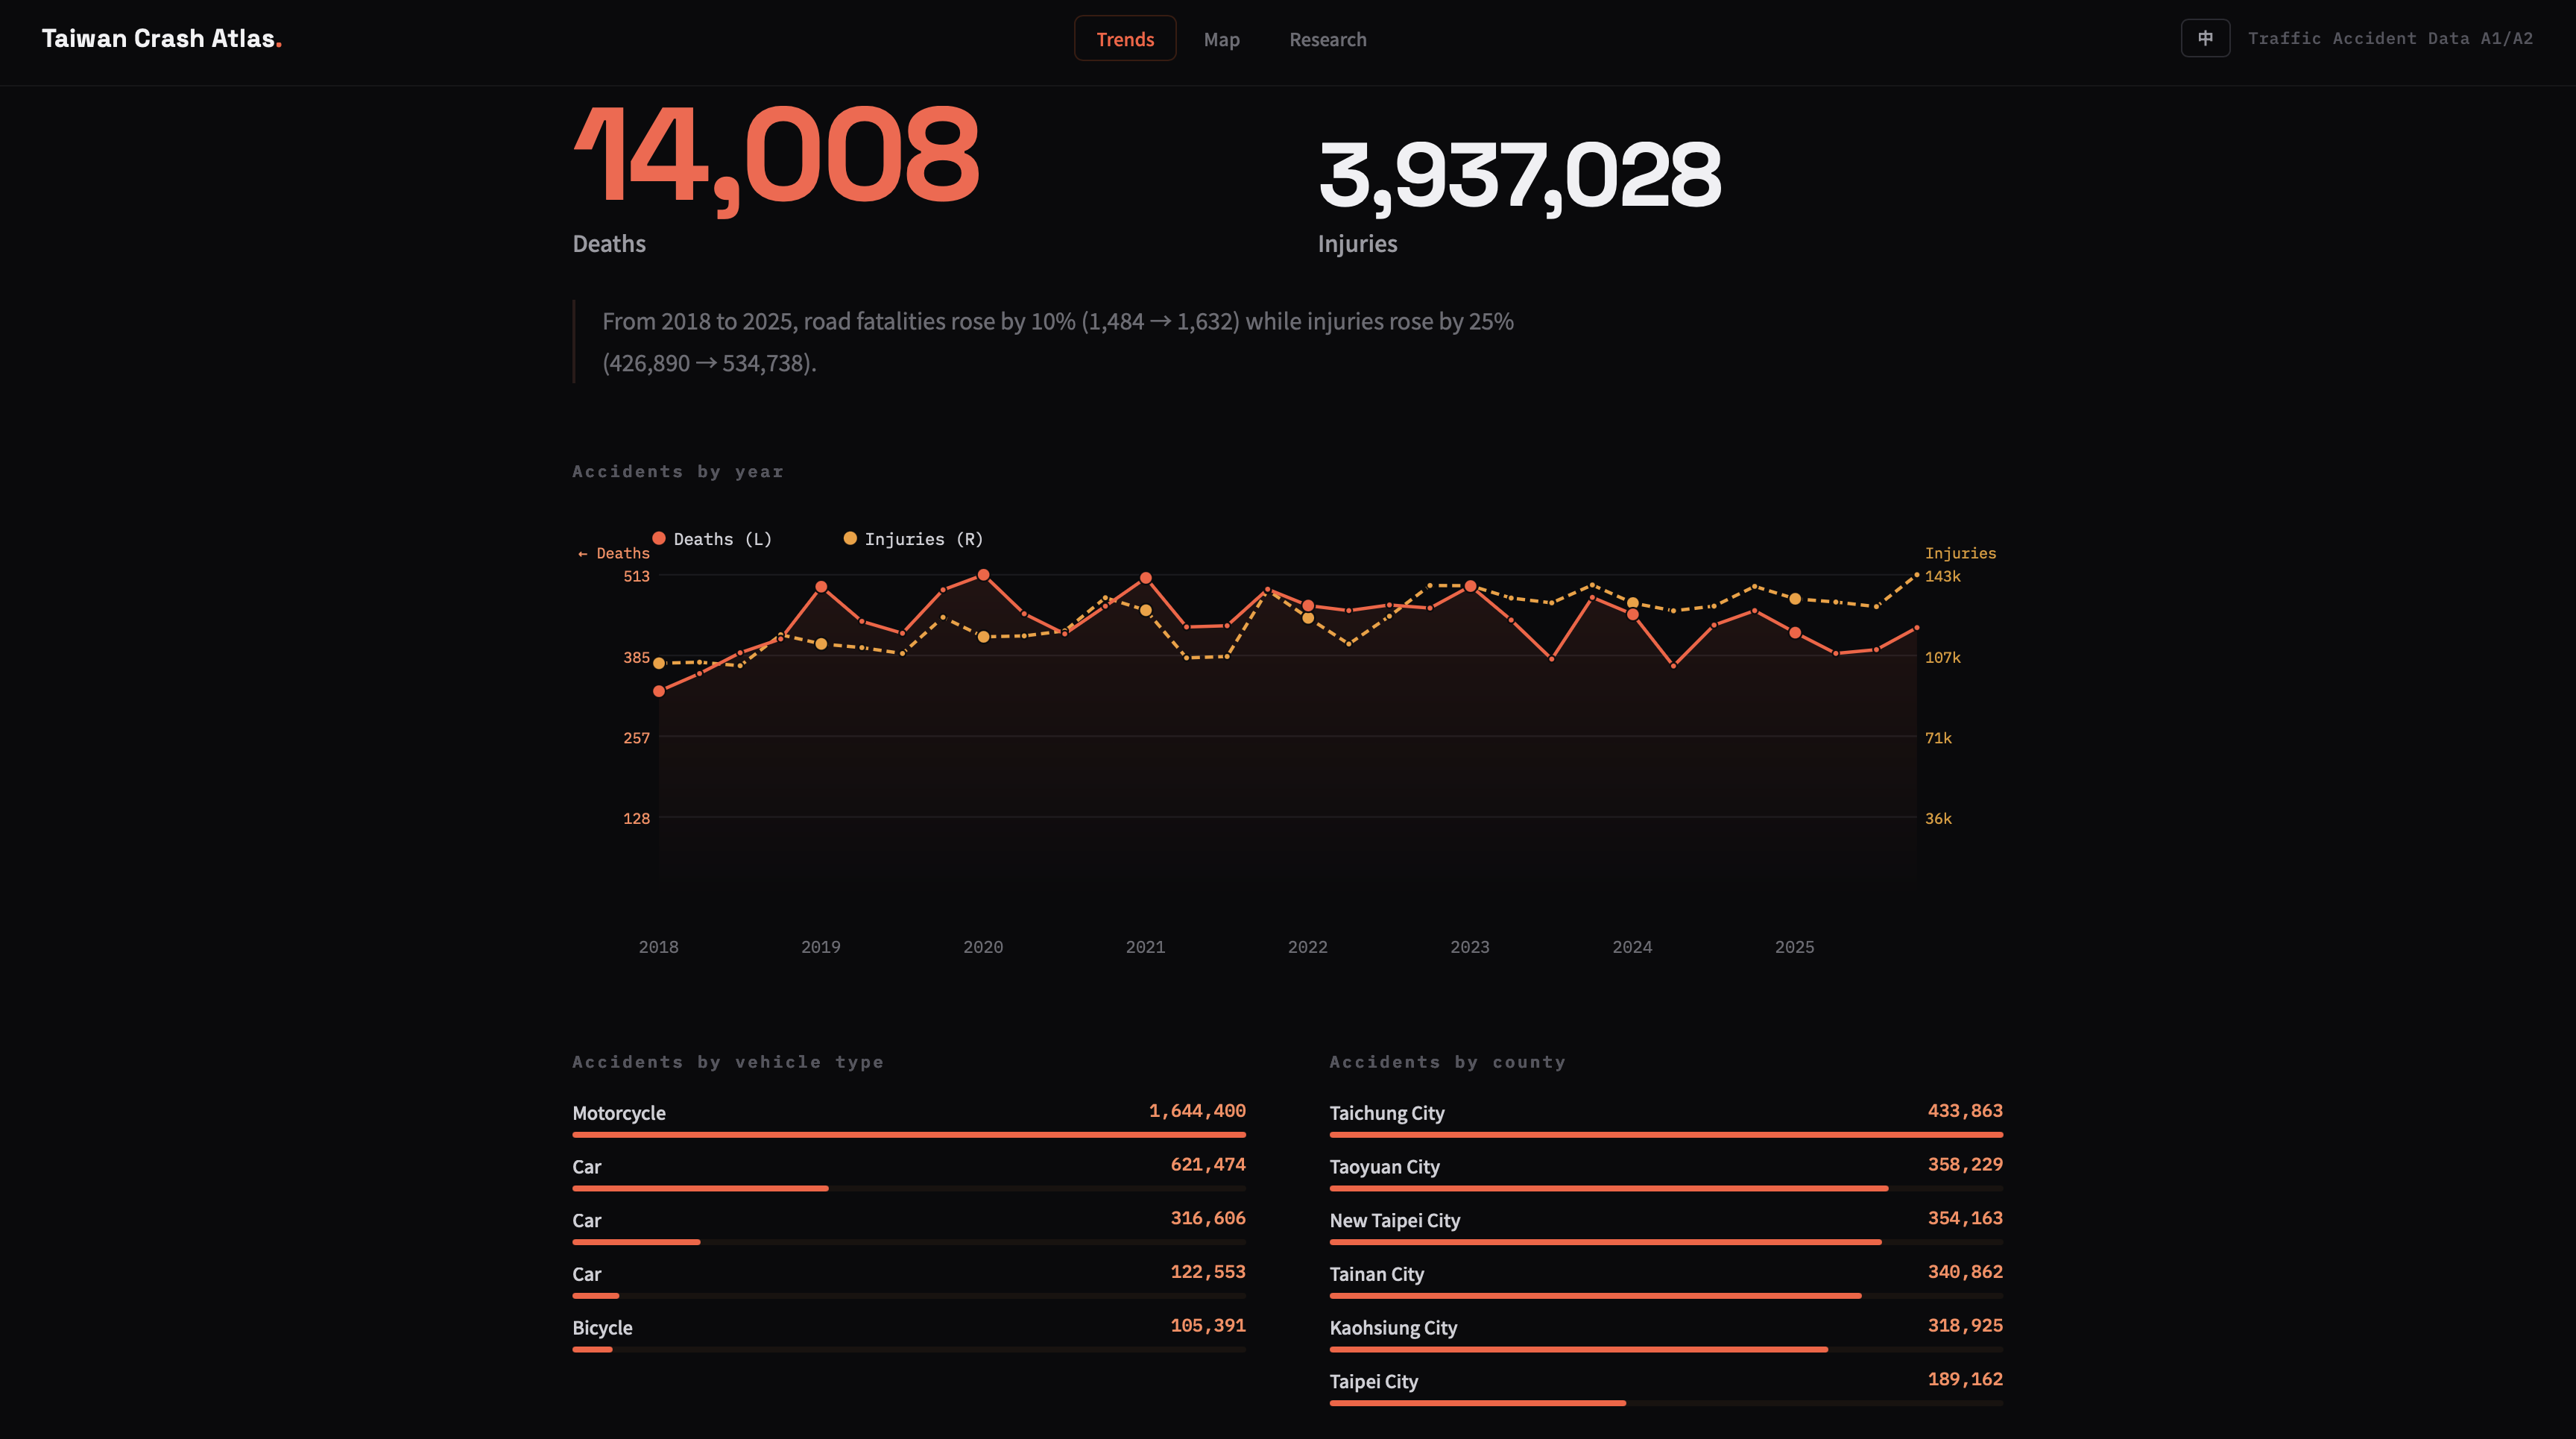
An interactive map of every traffic accident in Taiwan, each crash a single dot of light. Built from the National Police Agency’s A1/A2 open data, ready to explore, play, and filter.
- Every accident mapped. Hundreds of thousands of A1 (fatal) and A2 (injury) crashes as points of light.
- Daily timeline. Play the full year day by day, with running death and injury totals.
- Filters. Year, county, severity, and party type (motorcycle, car, truck, pedestrian).
- Click for detail. Time, location, weather, cause, and each party’s vehicle, sex, and age.
- Key stats. Peak hours, weather, location type, hot roads, leading causes.
- Bilingual interface.
Source: National Police Agency traffic accident open data (A1/A2).
R Packages
Taiwan’s government open data is a rich resource, but it is rarely tidy: formats, encodings, and release conventions differ from agency to agency, so downloading and cleaning it by hand is tedious and easy to get wrong. The R packages below exist to take that friction away — each automates the retrieval and cleaning of a particular public dataset so it can be read into an analysis environment quickly and reproducibly.
agrstat
Retrieves data from the Ministry of Agriculture’s Agricultural Statistics Dynamic Inquiry system. It reproduces the site’s stateful ASP.NET query flow, so the statistical category, dataset, classification strata, and time span are all set through arguments; a single agri_fetch() call walks the query wizard and returns the result table as a tidy data frame, defaulting to the full set of strata and years available.
twweather
Downloads Taiwan’s historical weather observations from the Central Weather Administration (CWA / CODiS) station network: tidy station metadata, station-level time series (hourly, daily, monthly), and township- or any-polygon estimates via inverse-distance-weighted spatial interpolation.
twhotel
Builds a hotel-by-month panel from the Taiwan Tourism Administration’s monthly Tourist Hotel Operating Statistics. It crawls, downloads, and parses the official workbooks into one tidy table covering occupancy, revenue, staffing, and guests by nationality — ready for empirical panel analysis.
plvr
Retrieves Taiwan’s actual real-estate transaction records (實價登錄) from the Ministry of the Interior open data. Given a date range, it downloads the spanning quarterly releases, keeps only the requested transaction categories (sales, pre-sale units, rentals) and regions, and stores them as compact Parquet files for efficient querying with arrow, dplyr, or DuckDB.
twcovid
Retrieves Taiwan CDC’s COVID-19 open data — confirmed cases and deaths — and reshapes it into analysis-ready panels. A single tw_covid() call sets the outcome, time unit (day, ISO week, or month), date basis (onset or case-judgment date), and panel cross-section (any subset of county, township, sex, imported status, age group), returning per-period flows or cumulative totals, optionally zero-filled into a balanced panel. Daily source files are aggregated internally, so the time axis is fully controlled and reproducible.
scen
An R client for the Taiwan Tourism Administration’s Tourism Statistics Database (觀光統計資料庫). With no public API on the source site, scen reproduces its request-signing scheme to return tidy tibbles of visitor counts for scenic and recreational spots (觀光遊憩據點), plus inbound, outbound, and cruise figures down to the finest cross-tabulations (e.g. age × gender × purpose) — with automatic ROC-year conversion, throttling, and caching.